> ## Documentation Index
> Fetch the complete documentation index at: https://prismeai-docs-next.mintlify.site/llms.txt
> Use this file to discover all available pages before exploring further.
# Observability
> Monitor workspace performance, errors, costs, and request traces
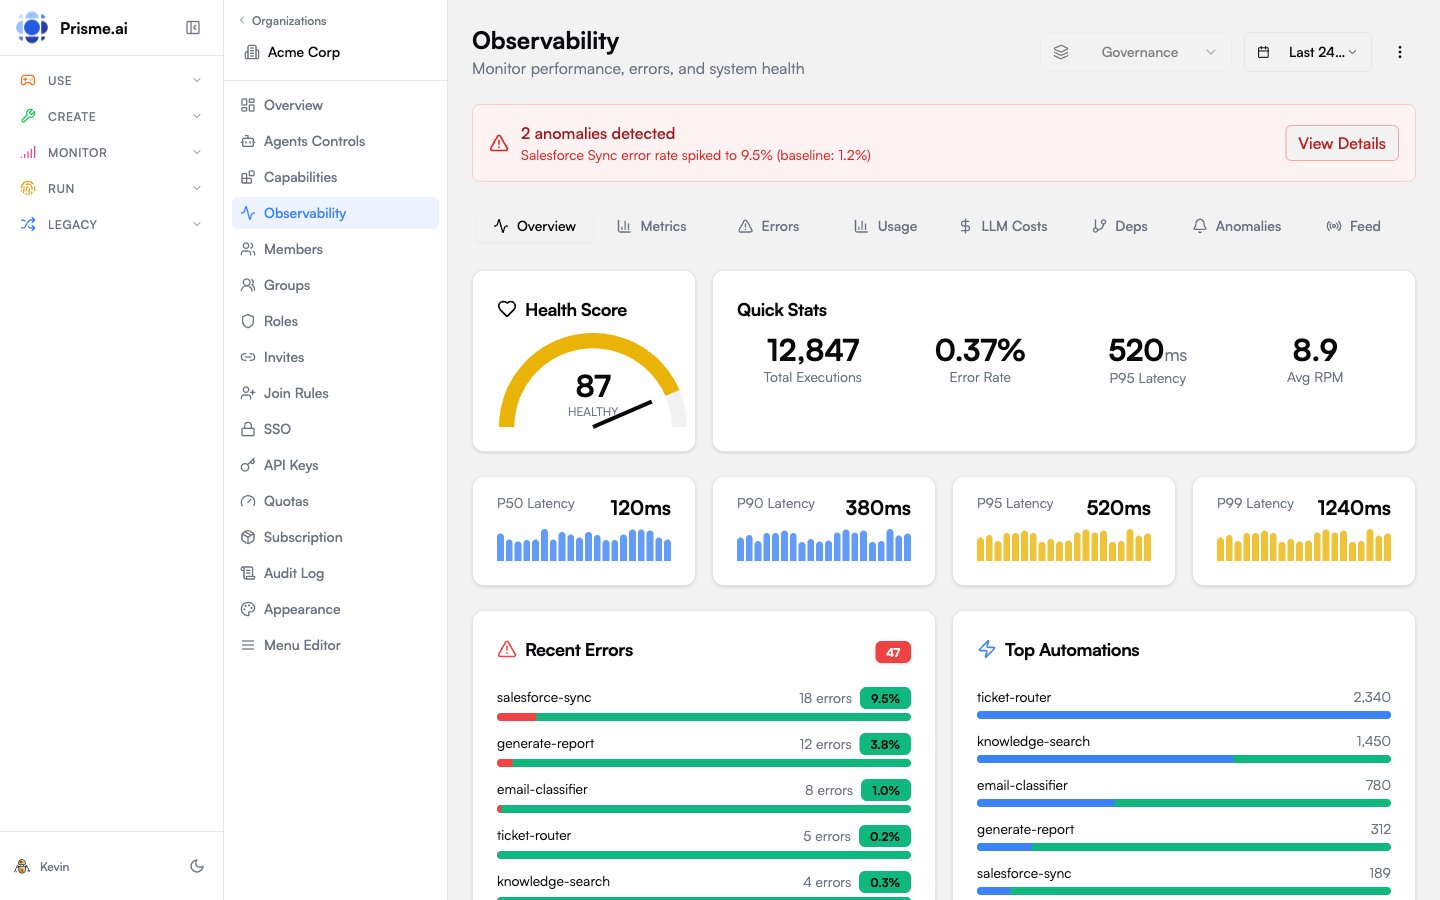 Observability provides deep visibility into your AI workspaces, tracking performance metrics, error rates, LLM costs, and detailed request traces. Access it from **Observability** in the Governe sidebar.
## Dashboard Overview
The observability dashboard shows key metrics at a glance:
| Metric | Description |
| -------------------- | ---------------------------------------------------------------- |
| **Health Score** | 0-100 composite score based on errors, latency, and availability |
| **Total Executions** | Number of automation runs in the selected period |
| **Error Rate** | Percentage of executions that failed |
| **P95 Latency** | 95th percentile response time |
| **LLM Costs** | Total cost of LLM calls |
## Health Score
The health score combines multiple factors into a single 0-100 metric:
| Status | Score Range | Color |
| ------------ | ----------- | ------ |
| **Healthy** | 90-100 | Green |
| **Degraded** | 70-89 | Yellow |
| **Critical** | 0-69 | Red |
### Factor Breakdown
| Factor | Weight | Calculation |
| ---------------- | ------ | ------------------------------- |
| **Error Rate** | 40% | Lower error rate = higher score |
| **Latency** | 30% | Lower latency = higher score |
| **Availability** | 30% | Higher uptime = higher score |
## Performance Metrics
### Latency Percentiles
Track response time distribution:
| Percentile | Description |
| ---------- | -------------------------------- |
| **P50** | Median response time |
| **P90** | 90% of requests faster than this |
| **P95** | 95% of requests faster than this |
| **P99** | 99% of requests faster than this |
### Slowest Automations
Identify bottlenecks by viewing automations ranked by average execution time.
### Timeline View
Visualize performance over time with:
* P95 latency trend (area chart)
* Request volume (line overlay)
This helps correlate load spikes with latency increases.
## Error Tracking
### Error Distribution
View errors grouped by:
* **Type**: `InvalidExpressionSyntax`, `FetchError`, `TimeoutError`, etc.
* **Automation**: Which automations generate the most errors
### Error Rate Trend
Track error rate changes over time to identify:
* New bugs introduced
* External service outages
* Configuration issues
### Recent Errors
View the latest errors with:
* Timestamp
* Error type and message
* Automation name
* Correlation ID (for tracing)
## LLM Costs
Monitor AI model consumption and costs:
### Cost Breakdown
| Metric | Description |
| ----------------- | ------------------------------ |
| **Total Calls** | Number of LLM API calls |
| **Total Cost** | Estimated cost in USD |
| **Total Tokens** | Input + output tokens consumed |
| **Carbon Impact** | Estimated CO2 emissions (kg) |
### By Model
See which models consume the most resources:
* Model name
* Number of calls
* Cost percentage
* Token count
### By Automation
Identify which automations drive LLM costs:
* Automation name
* Call count
* Relative usage
### Cost Timeline
Track daily cost trends to:
* Forecast monthly spend
* Identify cost anomalies
* Plan capacity
## Request Traces
Trace individual requests through the entire execution flow.
### Accessing Traces
1. From the Observability dashboard, click **View Traces**
2. Or click a correlation ID in the error list
### Trace View
Each trace shows:
| Element | Description |
| --------------- | -------------------------------- |
| **Summary** | Event count, duration, user info |
| **Timeline** | Waterfall view of all events |
| **Automations** | List of automations executed |
| **Errors** | Any errors encountered |
### Timeline Visualization
The waterfall chart shows:
* Each automation as a horizontal bar
* Start time offset from request start
* Duration of each step
* Errors highlighted in red
## Dependency Graph
Visualize how automations call each other.
### Graph View
* **Nodes**: Automations and installed apps
* **Edges**: Calls between components
* **Edge weight**: Call frequency
### Use Cases
* Understand system architecture
* Identify critical paths
* Find orphaned automations
## Anomaly Detection
Automatic detection of unusual patterns.
### Anomaly Types
| Type | Description |
| ----------------- | ---------------------------------- |
| **Error Spike** | Sudden increase in error rate |
| **Latency Spike** | Sudden increase in response time |
| **Traffic Spike** | Unusual increase in request volume |
| **Traffic Drop** | Unusual decrease in activity |
### Severity Levels
| Severity | Threshold |
| ------------ | ----------- |
| **Warning** | 2x baseline |
| **Critical** | 3x baseline |
### Configuration
Adjust detection sensitivity:
* **Low**: Only alert on significant anomalies
* **Medium**: Balanced detection (default)
* **High**: Alert on minor deviations
## Period Comparison
Compare metrics between two time periods.
### How to Compare
1. Select current period dates
2. Select comparison period dates
3. View side-by-side metrics
### Compared Metrics
* Execution count
* Error count and rate
* Average and P95 latency
* Unique users
### Trend Indicators
* **Up**: Increase > 5%
* **Down**: Decrease > 5%
* **Stable**: Within ±5%
## Real-Time Feed
Monitor events as they happen.
### Event Types
| Type | Description |
| ------------------------------ | -------------------- |
| `runtime.automations.executed` | Automation completed |
| `runtime.fetch.completed` | HTTP fetch succeeded |
| `runtime.fetch.failed` | HTTP fetch failed |
| `runtime.llm.completed` | LLM call completed |
| `error` | General error event |
### Filtering
* **All**: Show all events
* **Errors**: Only error events
* **Executions**: Only completion events
### Time Window
Configure how far back to show events (default: 60 minutes).
## Time Range Selection
All views support time range selection:
| Period | Description |
| ---------- | ------------------- |
| **1h** | Last hour |
| **24h** | Last 24 hours |
| **7d** | Last 7 days |
| **30d** | Last 30 days |
| **Custom** | Specific date range |
## Platform Summary (Admin Only)
Platform administrators see a platform-wide summary:
* Aggregate health score across all workspaces
* Total platform requests
* Combined LLM costs
* Peak capacity usage
## Best Practices
Establish normal performance baselines for comparison
Enable anomaly detection for early warning
Review LLM costs weekly to prevent surprises
Investigate errors using correlation IDs
## Troubleshooting
1. Check **Slowest Automations** for bottlenecks
2. Review the **Timeline** for load correlation
3. Examine traces for slow steps
4. Check external API response times
1. View **Error Distribution** by type
2. Check **Recent Errors** for patterns
3. Trace errors using correlation IDs
4. Review dependency health
1. Check **By Model** breakdown
2. Identify expensive automations
3. Review **Cost Timeline** for anomalies
4. Check for loops or inefficient prompts
## Next Steps
Control model access and costs
Track administrative changes
Observability provides deep visibility into your AI workspaces, tracking performance metrics, error rates, LLM costs, and detailed request traces. Access it from **Observability** in the Governe sidebar.
## Dashboard Overview
The observability dashboard shows key metrics at a glance:
| Metric | Description |
| -------------------- | ---------------------------------------------------------------- |
| **Health Score** | 0-100 composite score based on errors, latency, and availability |
| **Total Executions** | Number of automation runs in the selected period |
| **Error Rate** | Percentage of executions that failed |
| **P95 Latency** | 95th percentile response time |
| **LLM Costs** | Total cost of LLM calls |
## Health Score
The health score combines multiple factors into a single 0-100 metric:
| Status | Score Range | Color |
| ------------ | ----------- | ------ |
| **Healthy** | 90-100 | Green |
| **Degraded** | 70-89 | Yellow |
| **Critical** | 0-69 | Red |
### Factor Breakdown
| Factor | Weight | Calculation |
| ---------------- | ------ | ------------------------------- |
| **Error Rate** | 40% | Lower error rate = higher score |
| **Latency** | 30% | Lower latency = higher score |
| **Availability** | 30% | Higher uptime = higher score |
## Performance Metrics
### Latency Percentiles
Track response time distribution:
| Percentile | Description |
| ---------- | -------------------------------- |
| **P50** | Median response time |
| **P90** | 90% of requests faster than this |
| **P95** | 95% of requests faster than this |
| **P99** | 99% of requests faster than this |
### Slowest Automations
Identify bottlenecks by viewing automations ranked by average execution time.
### Timeline View
Visualize performance over time with:
* P95 latency trend (area chart)
* Request volume (line overlay)
This helps correlate load spikes with latency increases.
## Error Tracking
### Error Distribution
View errors grouped by:
* **Type**: `InvalidExpressionSyntax`, `FetchError`, `TimeoutError`, etc.
* **Automation**: Which automations generate the most errors
### Error Rate Trend
Track error rate changes over time to identify:
* New bugs introduced
* External service outages
* Configuration issues
### Recent Errors
View the latest errors with:
* Timestamp
* Error type and message
* Automation name
* Correlation ID (for tracing)
## LLM Costs
Monitor AI model consumption and costs:
### Cost Breakdown
| Metric | Description |
| ----------------- | ------------------------------ |
| **Total Calls** | Number of LLM API calls |
| **Total Cost** | Estimated cost in USD |
| **Total Tokens** | Input + output tokens consumed |
| **Carbon Impact** | Estimated CO2 emissions (kg) |
### By Model
See which models consume the most resources:
* Model name
* Number of calls
* Cost percentage
* Token count
### By Automation
Identify which automations drive LLM costs:
* Automation name
* Call count
* Relative usage
### Cost Timeline
Track daily cost trends to:
* Forecast monthly spend
* Identify cost anomalies
* Plan capacity
## Request Traces
Trace individual requests through the entire execution flow.
### Accessing Traces
1. From the Observability dashboard, click **View Traces**
2. Or click a correlation ID in the error list
### Trace View
Each trace shows:
| Element | Description |
| --------------- | -------------------------------- |
| **Summary** | Event count, duration, user info |
| **Timeline** | Waterfall view of all events |
| **Automations** | List of automations executed |
| **Errors** | Any errors encountered |
### Timeline Visualization
The waterfall chart shows:
* Each automation as a horizontal bar
* Start time offset from request start
* Duration of each step
* Errors highlighted in red
## Dependency Graph
Visualize how automations call each other.
### Graph View
* **Nodes**: Automations and installed apps
* **Edges**: Calls between components
* **Edge weight**: Call frequency
### Use Cases
* Understand system architecture
* Identify critical paths
* Find orphaned automations
## Anomaly Detection
Automatic detection of unusual patterns.
### Anomaly Types
| Type | Description |
| ----------------- | ---------------------------------- |
| **Error Spike** | Sudden increase in error rate |
| **Latency Spike** | Sudden increase in response time |
| **Traffic Spike** | Unusual increase in request volume |
| **Traffic Drop** | Unusual decrease in activity |
### Severity Levels
| Severity | Threshold |
| ------------ | ----------- |
| **Warning** | 2x baseline |
| **Critical** | 3x baseline |
### Configuration
Adjust detection sensitivity:
* **Low**: Only alert on significant anomalies
* **Medium**: Balanced detection (default)
* **High**: Alert on minor deviations
## Period Comparison
Compare metrics between two time periods.
### How to Compare
1. Select current period dates
2. Select comparison period dates
3. View side-by-side metrics
### Compared Metrics
* Execution count
* Error count and rate
* Average and P95 latency
* Unique users
### Trend Indicators
* **Up**: Increase > 5%
* **Down**: Decrease > 5%
* **Stable**: Within ±5%
## Real-Time Feed
Monitor events as they happen.
### Event Types
| Type | Description |
| ------------------------------ | -------------------- |
| `runtime.automations.executed` | Automation completed |
| `runtime.fetch.completed` | HTTP fetch succeeded |
| `runtime.fetch.failed` | HTTP fetch failed |
| `runtime.llm.completed` | LLM call completed |
| `error` | General error event |
### Filtering
* **All**: Show all events
* **Errors**: Only error events
* **Executions**: Only completion events
### Time Window
Configure how far back to show events (default: 60 minutes).
## Time Range Selection
All views support time range selection:
| Period | Description |
| ---------- | ------------------- |
| **1h** | Last hour |
| **24h** | Last 24 hours |
| **7d** | Last 7 days |
| **30d** | Last 30 days |
| **Custom** | Specific date range |
## Platform Summary (Admin Only)
Platform administrators see a platform-wide summary:
* Aggregate health score across all workspaces
* Total platform requests
* Combined LLM costs
* Peak capacity usage
## Best Practices
Establish normal performance baselines for comparison
Enable anomaly detection for early warning
Review LLM costs weekly to prevent surprises
Investigate errors using correlation IDs
## Troubleshooting
1. Check **Slowest Automations** for bottlenecks
2. Review the **Timeline** for load correlation
3. Examine traces for slow steps
4. Check external API response times
1. View **Error Distribution** by type
2. Check **Recent Errors** for patterns
3. Trace errors using correlation IDs
4. Review dependency health
1. Check **By Model** breakdown
2. Identify expensive automations
3. Review **Cost Timeline** for anomalies
4. Check for loops or inefficient prompts
## Next Steps
Control model access and costs
Track administrative changes